In February 2023, Google introduced its Bard chatbot in a promotional video. It was asked which discoveries from the James Webb telescope it could share with a nine-year-old, and it answered, with complete ease, that Webb had taken the first photograph of a planet outside our solar system. The claim was false: that image had been captured by another observatory almost two decades earlier. There was nothing spectacular about the mistake except for one thing: it sounded perfect. That same day, Alphabet lost around one hundred billion dollars in market value.
The episode is usually told as an anecdote about how rushed Google was. We find it interesting for another reason. The underlying problem wasn't that the model got something wrong, because every system gets things wrong. The problem was that it got it wrong without anything in the answer betraying the error. There was no hesitation, no warning, no footnote saying where the figure came from. The sentence had the same shape as a correct answer, and that is exactly the trap.
The mistake you can't see is the only one that matters
When a human analyst makes a mistake, there is almost always a trail. There is a debatable assumption, a source someone can ask for, a number that doesn't square with the rest of the spreadsheet. The error is visible and, therefore, fixable. A generative language model breaks that guarantee. It produces statistically plausible text in which an invented figure looks just as real as a true one. A number that exists and one the model built because it fit the sentence are stated with the same confidence.
This isn't a hunch of ours: it has been measured. A 2024 study from the Stanford RegLab found that general-purpose chatbots hallucinate between 58% and 88% of the time when answering specific, verifiable legal questions. The most uncomfortable finding from the same group came later: specialized legal research tools, the ones that already use document retrieval to ground their answers, still made things up between 17% and 33% of the time. In other words, "connecting the model to sources" reduces the problem, but it does not eliminate it. As long as the model is the one writing the final number, the final number can be invented.
In the financial world this stops being an academic problem. Air Canada learned it in court: its chatbot promised a passenger a refund policy that didn't exist; the airline argued it wasn't responsible for what its own bot said, and the court ordered it to pay anyway. Deloitte Australia learned it in 2025, when it had to refund part of a 440,000 Australian dollar contract for a government report that contained nonexistent academic citations and a fabricated quote from a court ruling. In both cases the content looked impeccable until someone went looking for the source and couldn't find it.
A chart is a claim wearing a tie
With charts the risk multiplies, because a chart doesn't look like an opinion: it looks like evidence. A rising curve communicates a trend before you even read the axis. If you let a language model "draw" the series, you are handing the authority of a measuring instrument to something that is only completing patterns. The result can be a beautiful, clean trend that never happened, and no one will question it because charts are rarely questioned. They inherit the credibility of the format.
That is why, when we built Alicanto Analysts, we made a decision that defines everything else: the language model does not compute the numbers or draw the charts. It only orchestrates.
How we solved it: the model orchestrates, the code answers
The usual way to sell a data assistant is to say it is "connected to reliable sources." The Stanford data shows that isn't enough. Our bet is stricter: to take away from the model the responsibility of producing the fact.
In Alicanto Analysts the model intervenes at only a few decision points. It interprets your question, decides which data needs to be retrieved and chooses how to present it. But the data does not come from it. It comes from deterministic Python code that queries a closed catalog of real series, today indicators from the Central Bank and bank accounts reported to the Financial Market Commission. That code searches, transforms and calculates the same way every time, and the model can only choose among the entities that catalog offers. If it tries to request a series that doesn't exist, it simply doesn't find it, because there is no way to invent an identifier the catalog doesn't contain.
That catalog is exactly what we connect to each client's internal data. The public sample runs on the Central Bank and the CMF, but the product plugs into the organization's internal databases. We build search tools tailored to each source and add transformations that are cross-cutting to all of them, where you only have to declare the shape of the data: a time series, a panel. The guarantee doesn't change. The model still chooses among entities that really exist and the code still brings the number, now over your own data. That is why a bank can connect it to its operation without losing the "it doesn't invent."
The detail we like most is in how the answer is written. The component that writes the prose is forbidden from writing numbers. When it wants to say that deposits grew by a certain percentage, it doesn't write the figure: it writes a reserved placeholder, a kind of named gap. The deterministic code fills that gap with the real, already-computed value, with its unit and its rounding. There is a check that rejects the answer if it detects a number written by hand in the middle of the text. If the model claims one series rose more than another, another routine recomputes that comparison against the data and corrects it if it is false. The number you read never passed through the model's imagination.
The charts follow the same logic. The type of visualization is chosen by a deterministic rule based on the shape of the data, and the series that gets plotted is the one the code computed. The model can only refer to the chart to comment on it, it cannot fabricate it. What you see drawn is a faithful reflection of what was computed, not an illustration inspired by the question.
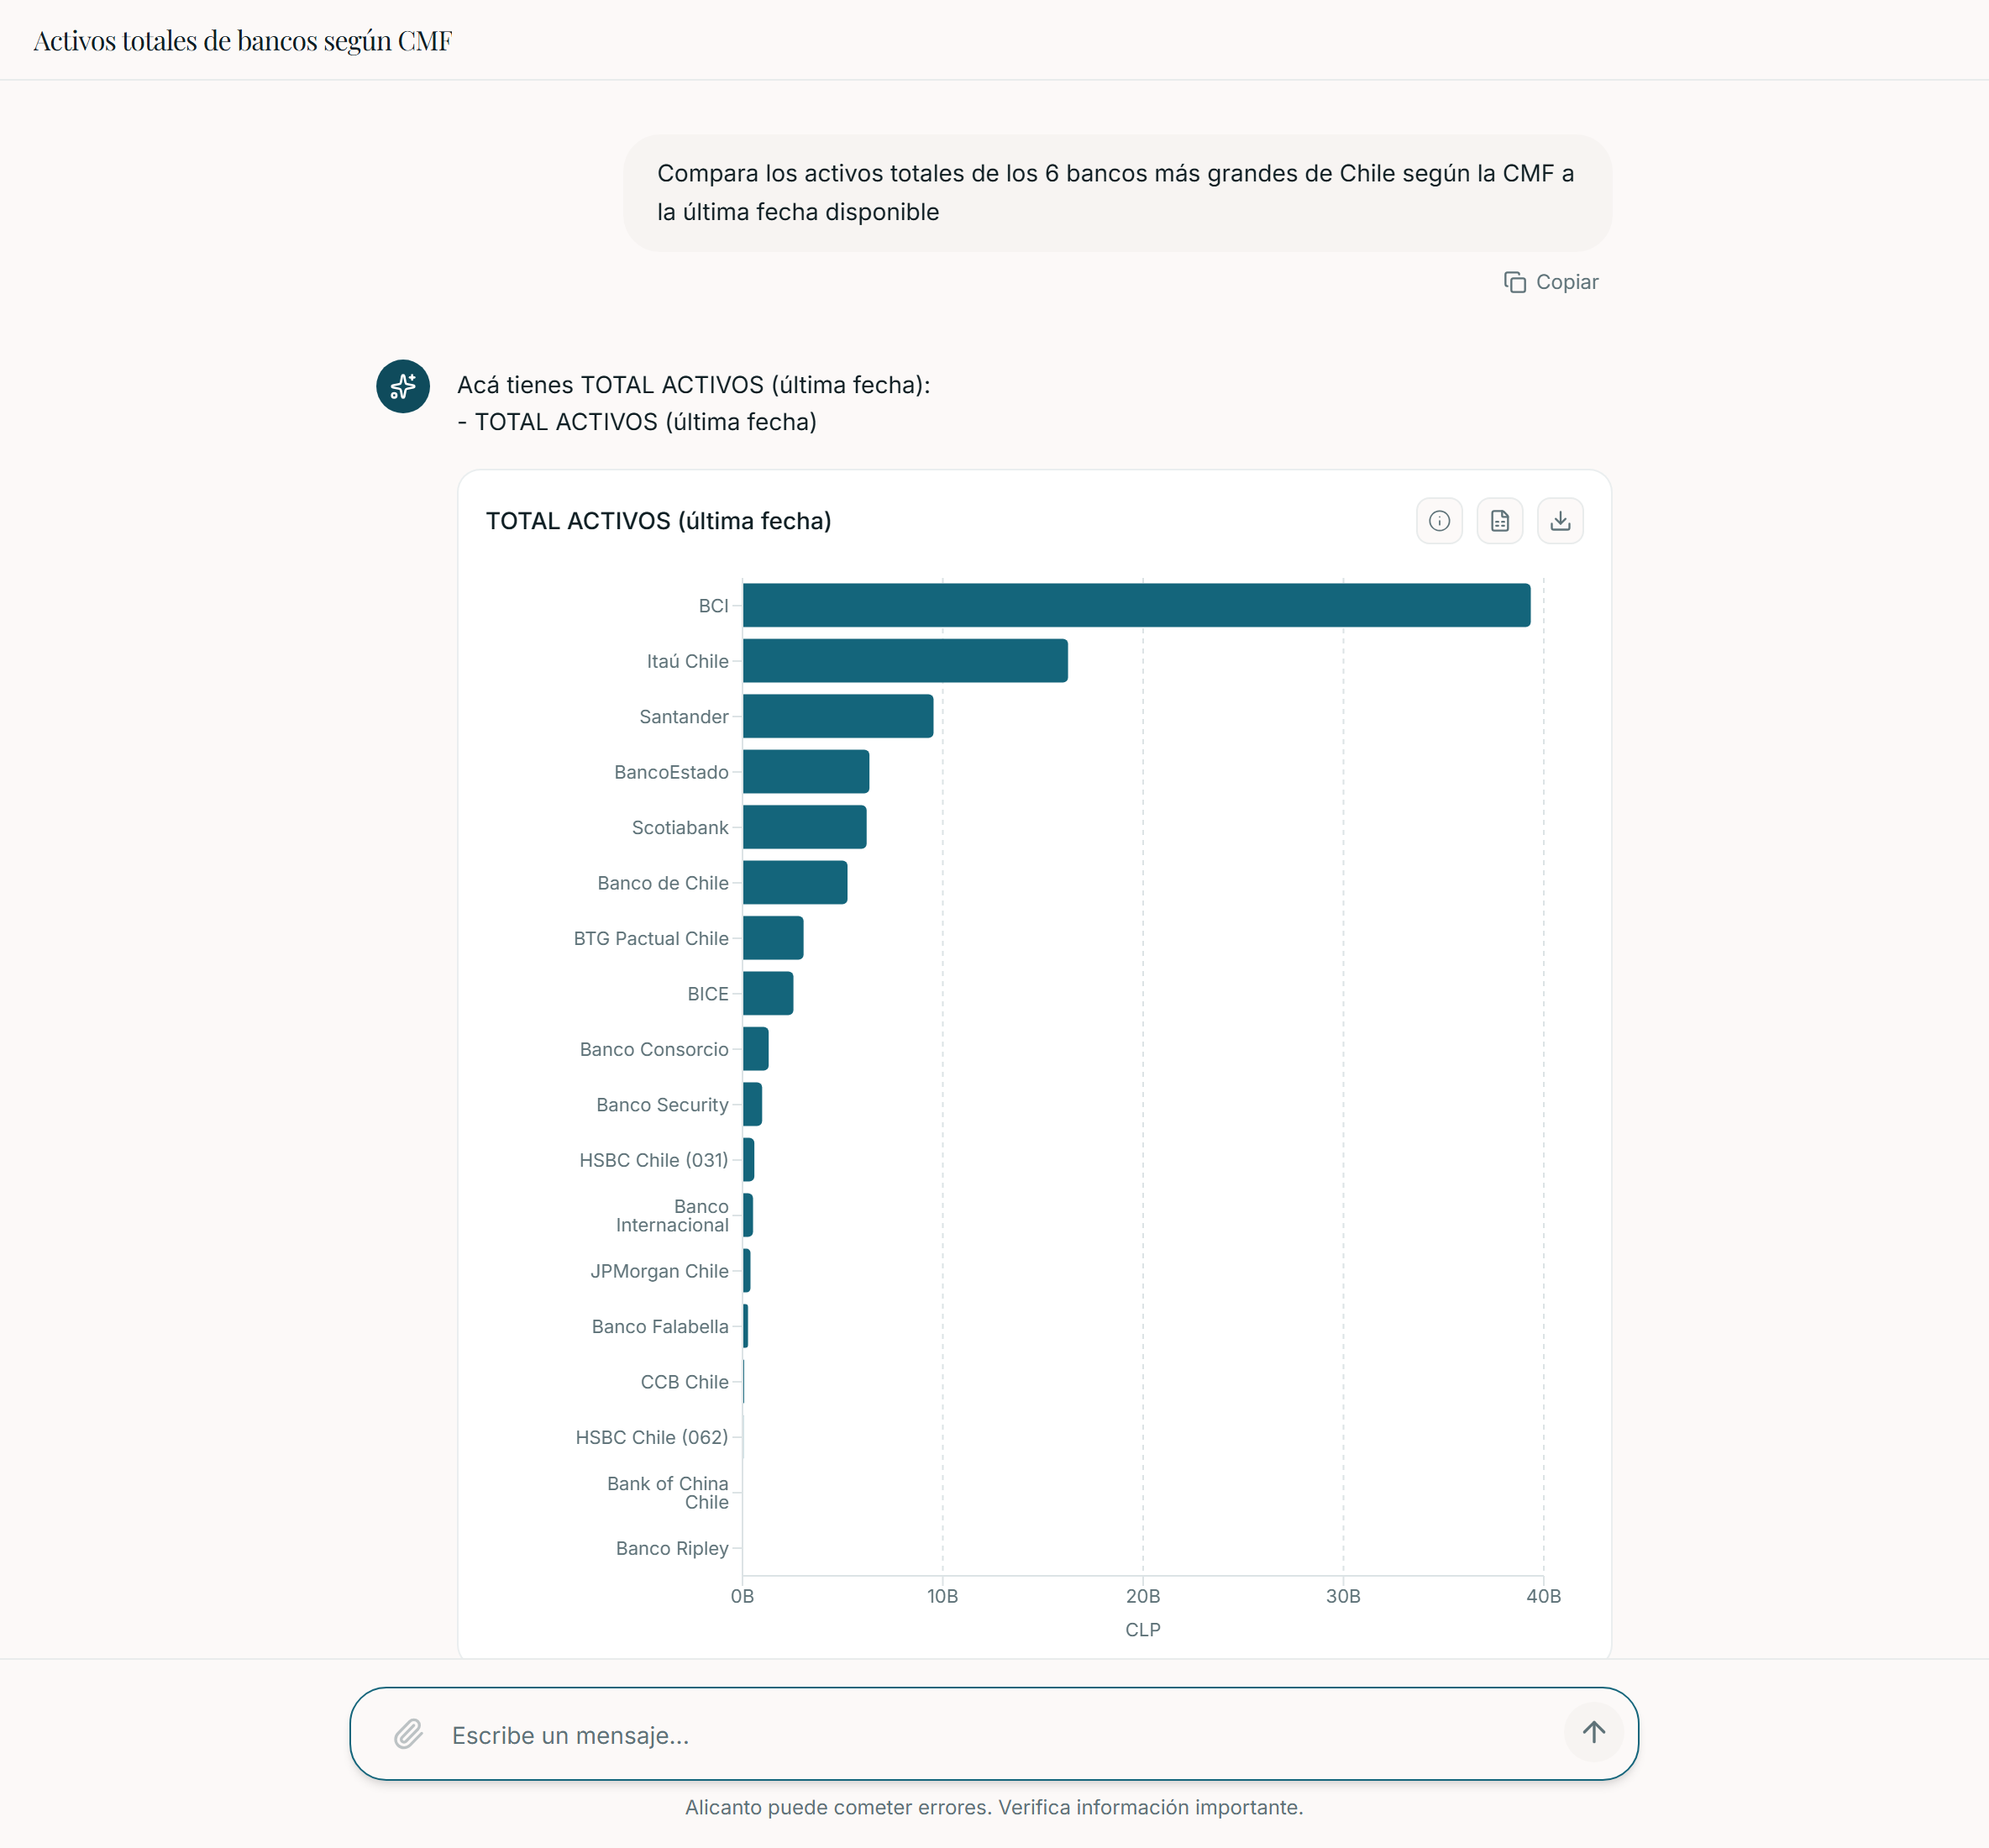
The source of every figure, in the same place as the figure
All of the above would be hard to audit if it stayed hidden. That is why every answer carries its own traceability. Next to each chart there is a list of the steps that were executed, written in plain language: where the series was drawn from, over what time window, which transformations were applied, how currencies were converted. It is not a technicality buried in a log: it is next to the number, you can open it, and you can export both the chart and the raw data to review on your own. If someone on your team asks where that figure came from, the answer is already there.
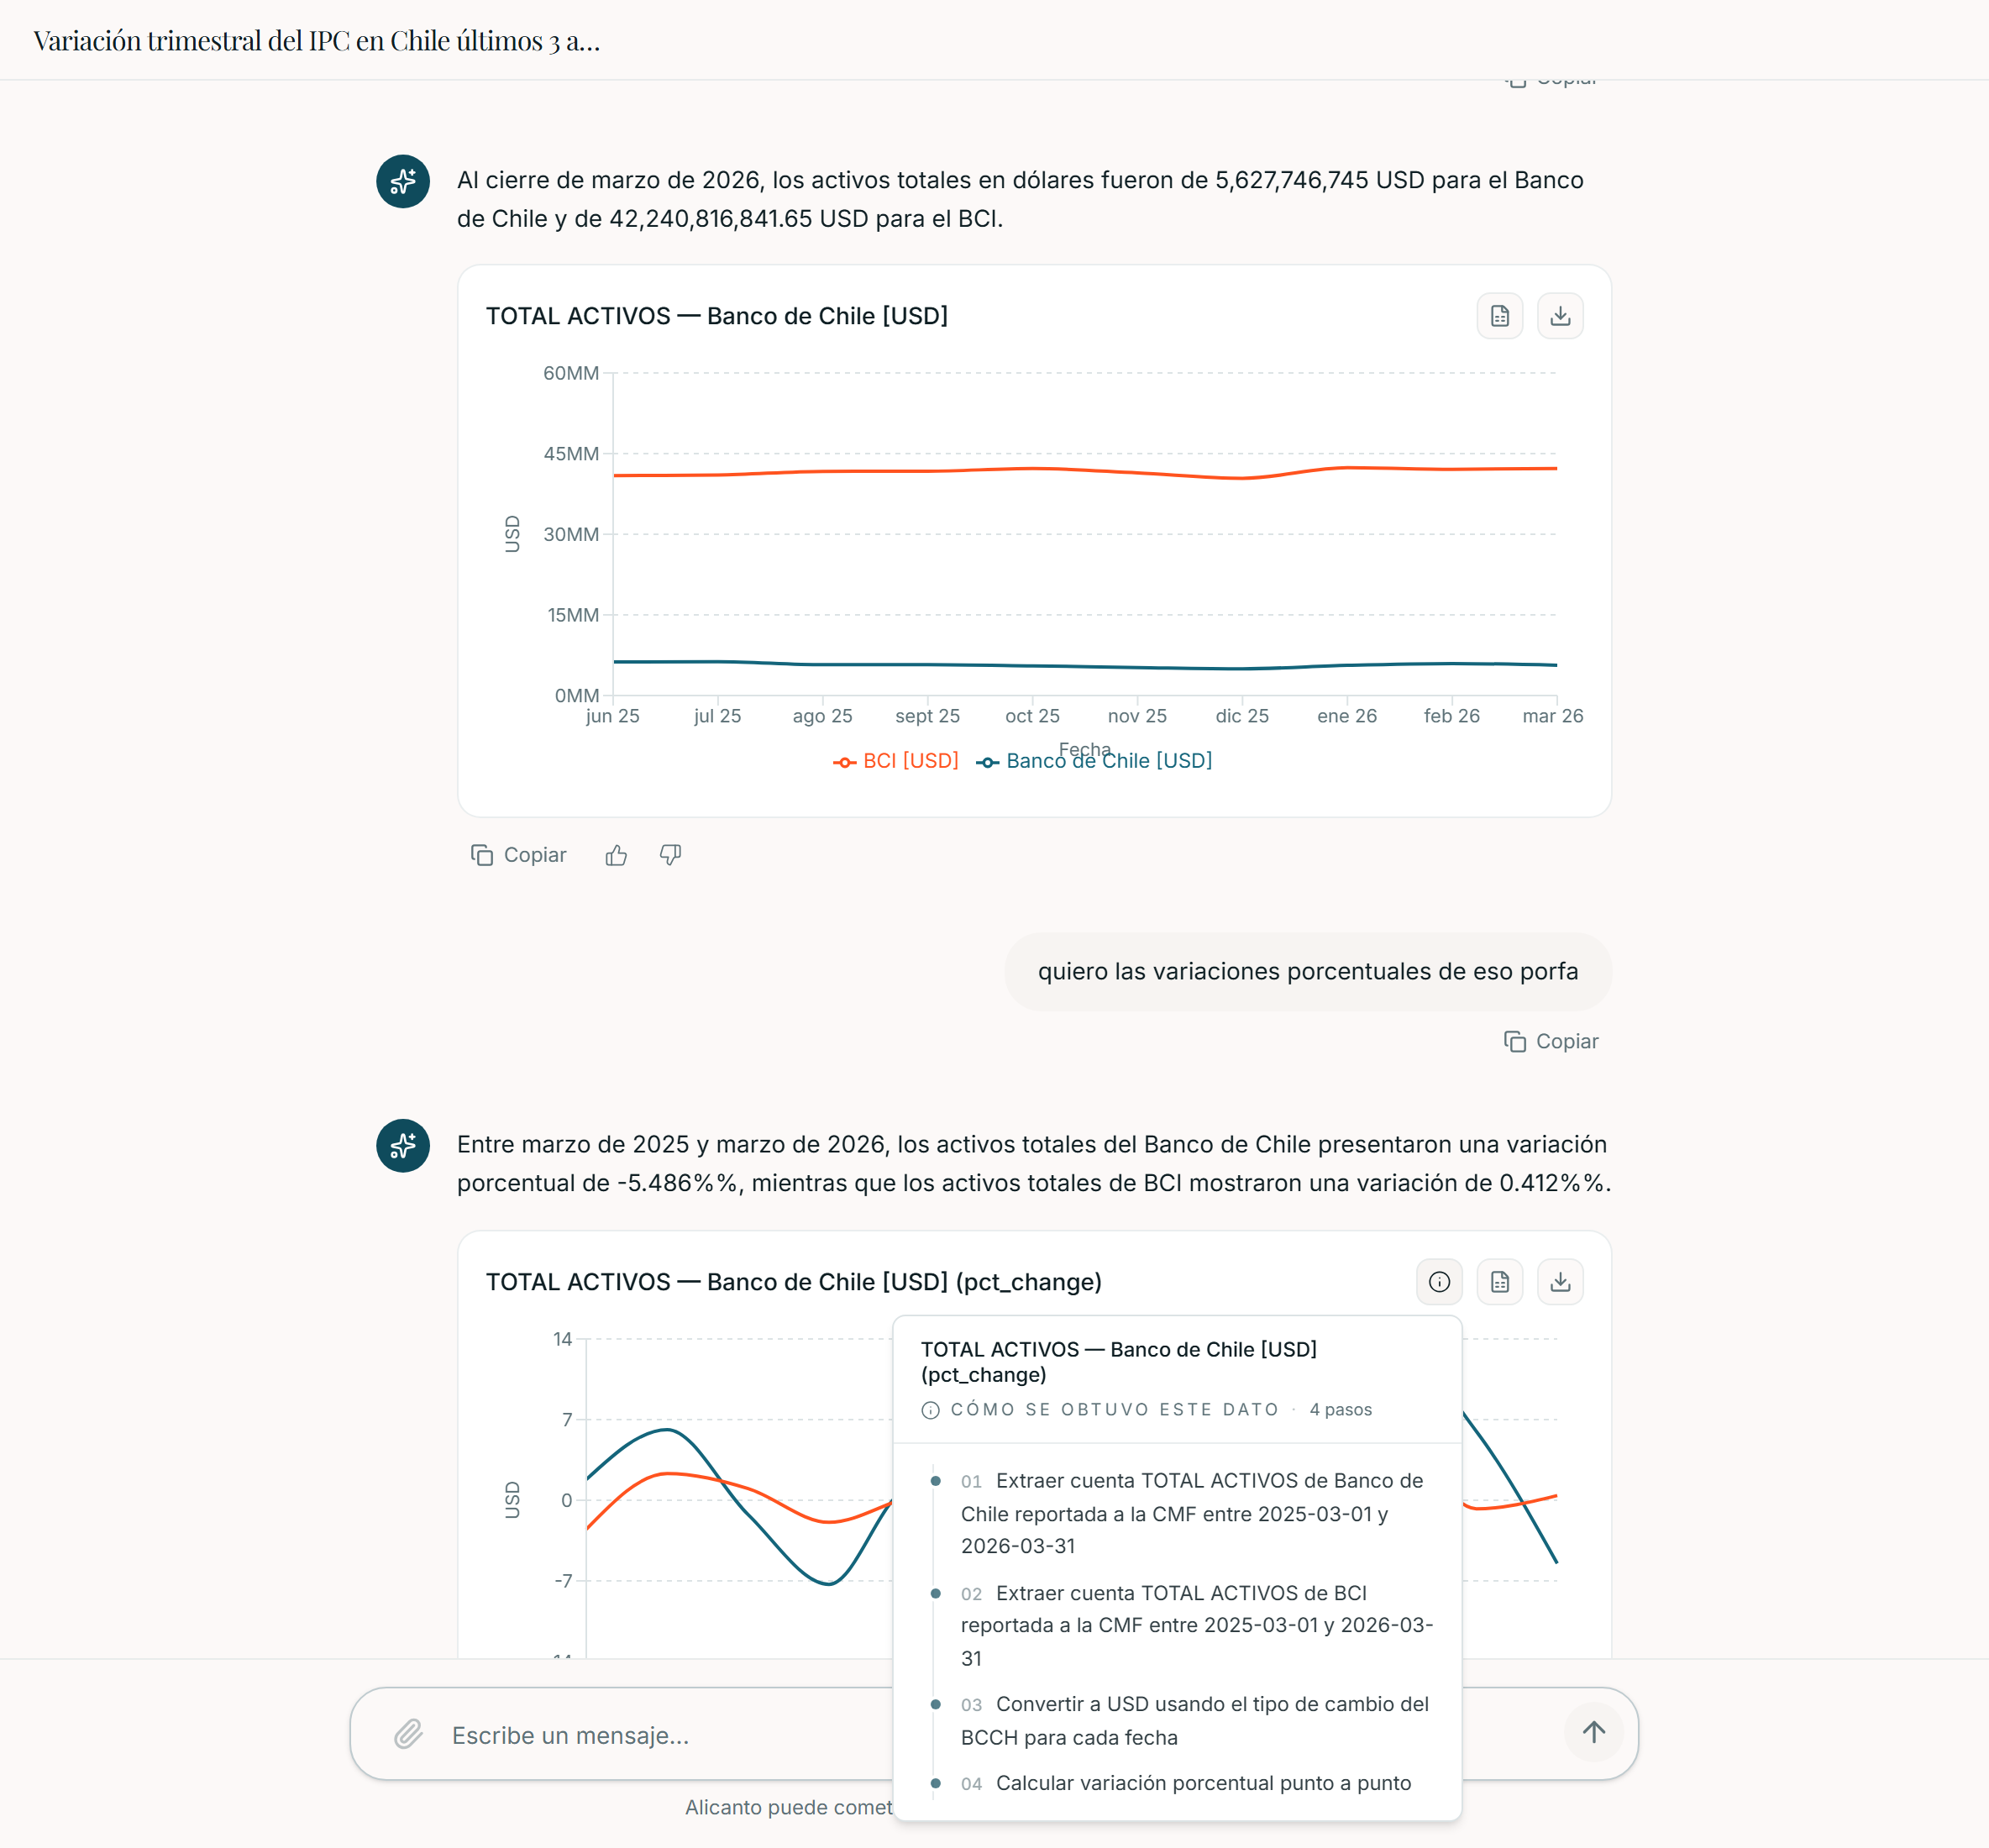
The idea we defend is simple. In the financial system, the people who decide do not access the data directly: they depend on someone to bring it to them, and that dependence is only healthy if they can verify what they receive. An assistant that answers quickly but doesn't show where it got the number doesn't solve that problem: it disguises it. We prefer a system that abstains when there is no evidence and that shows the source of every figure, even if that means saying "I don't have this" more often. A financial figure with no verifiable origin isn't information, it's a well-dressed opinion, and no decision that matters should rest on that.
Sources
- Google shares lose $100 billion after company's AI chatbot makes an error during demo · CNN Business
- Air Canada must pay refund promised by AI chatbot, tribunal rules · AOL / Reuters
- Air Canada Held Responsible for Chatbot's Hallucinations · AI Business
- Deloitte to refund Australian government after AI hallucinations found in report · Fast Company
- Hallucinating Law: Legal Mistakes with Large Language Models are Pervasive · Stanford Law School / RegLab
- Stanford study finding AI legal research tools hallucinate in 17% to 33% of queries · LawSites